In any given year since 2017 between 2.7 and 2.8 million US residents die. These numbers are stable and vary only by 50,000 or so depending on how bad the flu season is. So, they become the expected numbers for 2020. Unfortunately, the actual 2020 numbers are on a track to be between 3.0 and 3.1 million deaths.
As the disease spreads, it is increasingly likely that you or your friends and family know someone who has died from Covid-19 or has been infected. Recognizing the common humanity in all our stories is top of mind, but especially when it comes to the families and friends of “essential workers” who we honor for keeping the economy running because many face increased risks of infection.
If we consider the number of 2020 deaths nationwide reported by the CDC, so far 235,000 more have died than the 2017-2019 average would suggest. Nearly all the excess deaths are likely to have involved Covid-19 infections — even if it was not the primary cause. As of mid-August 2020 deaths are 13% higher than the 2017-2019 average, and they are 19% above the 2017-2019 average if we exclude January and February.
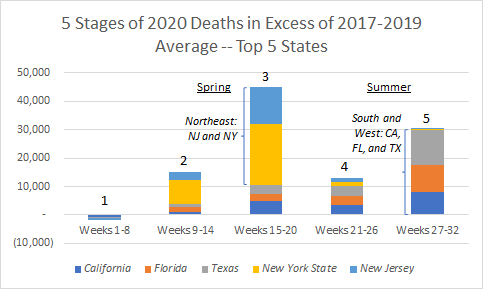
The CDC data tell the story of our “US family” and a Covid-19 pandemic that has torn across the country in 5 stages. Stage 1 had 2020 starting out close to prior years in terms of total deaths. Stages 2 and 3 had many excess deaths in the Northeast. Stages 4 and 5 had many excess deaths in the South and West. Five large states account for over half of 2020’s excess deaths illustrate what’s happened. The timing of these 5 stages moves left to right in the chart with most excess deaths in the Northeast this spring and in the South and West this summer.
Number 2020 Deaths in Excess of 2017-2019 Average for 5 States — for all Causes, Including Covid-19
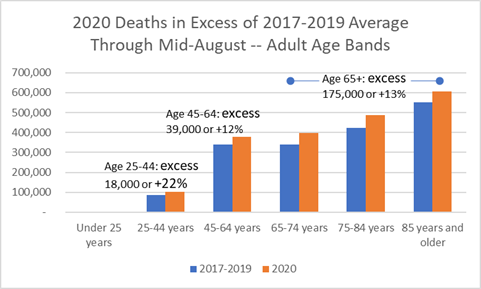
In any given year adults age 65 and older account for 76% of all deaths, and through mid-August 2020 they account for 75% of all deaths — even those that are in excess of prior year averages for these age bands.
Interestingly, no excess deaths are reported for adults under 25 during the pandemic. However, while adults 25-44 are typically only 5% of all deaths, they account for 18,000, or 8%, of excess deaths. On a year-over-year basis, adults in this age band have increased chances of dying by 22%, while the chances of dying has increased 13% for adults 65 and older. The disproportionate impact on 25-44 year-olds may be because they are over-represented by essential workers with young families that have inadequate health care options to combat Covid-19. We don’t know this, though, since occupation and age data is not published yet, though it seems likely.
Percent of all US 2020 Deaths in Excess of 2017-2019 Average by Age Band — for all Causes Including Covid-19
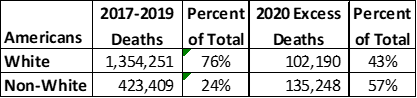
In terms of race, the story could not be clearer. White Americans account for 76% of all deaths on average, but through mid-August 2020 white Americans account for just 43% of the excess deaths. It is a concern, therefore, that during the pandemic non-whites account for a 57% majority of 2020 excess deaths though in 2017-2019 they only averaged 24% of the deaths.
Number of through Mid-August: Average Deaths 2017-2019 and Number of Excess Deaths 2020 by Race and Heritage
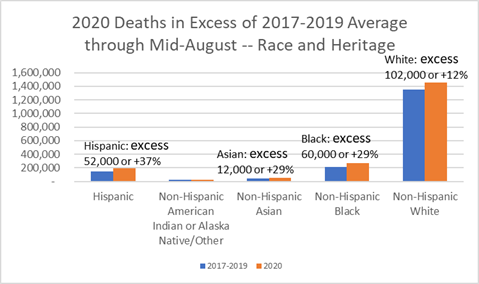
On a year-over-year bases, Covid-19 has increased the chances of death for white Americans by 12% if we assume all excess deaths involve Covid-19 disease one way or another, but the chances of black, asian, and hispanic Americans dying has increased by 29% to 37%.
Percent of all US 2020 Deaths in Excess of 2017-2019 Average by Race and Heritage — for all Causes Including Covid-19
Though they are not the majority, non-white Americans have the majority of excess deaths in 2020. Anecdotally, we know more non-white Americans are essential workers with families that have inadequate health care options to combat Covid-19 . That story remains to be told completely until job and race updates are published. But it seems likely and it is unfortunate that 2020 has been such a year of excess — in so many ways.
Ref. CDC
Note: The number of tests and positives has changed, as well, but is not consider here because the data is determined by testing availability which has changed over time and by state. Therefore, testing data is better suited for local analysis and not considered here.